Technology Services @Tuvis

A Tuvis Vertical

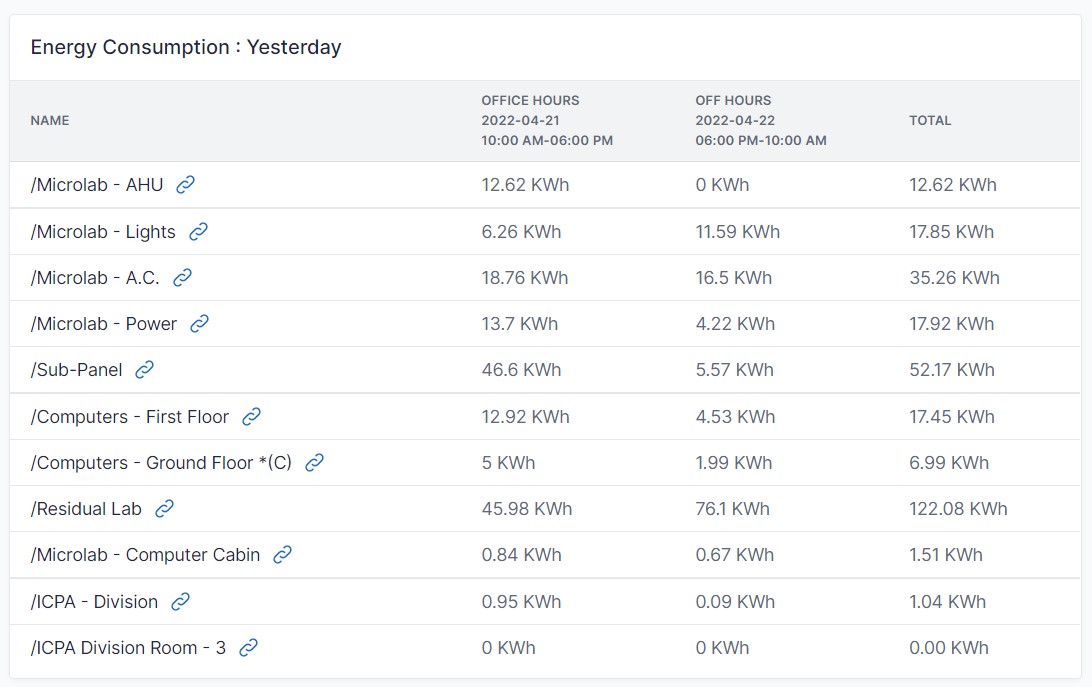
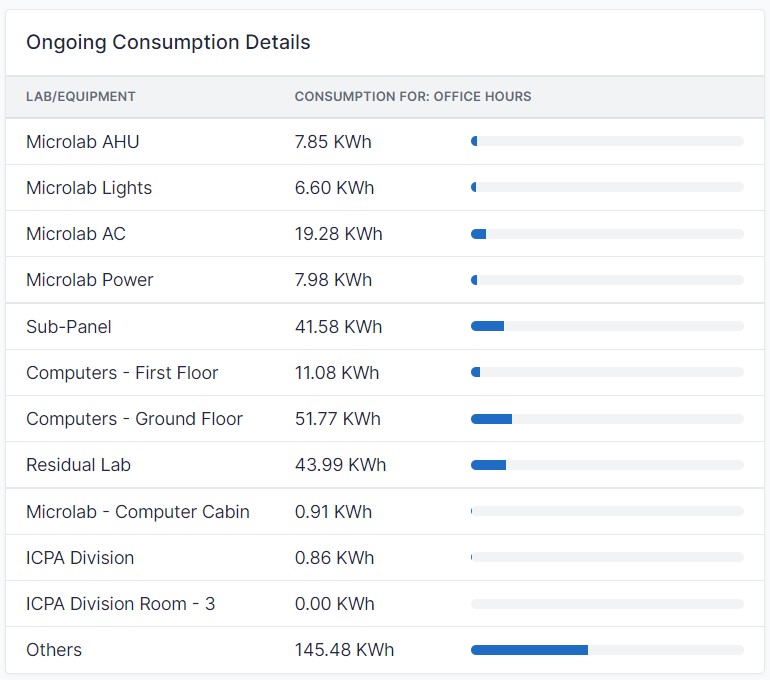
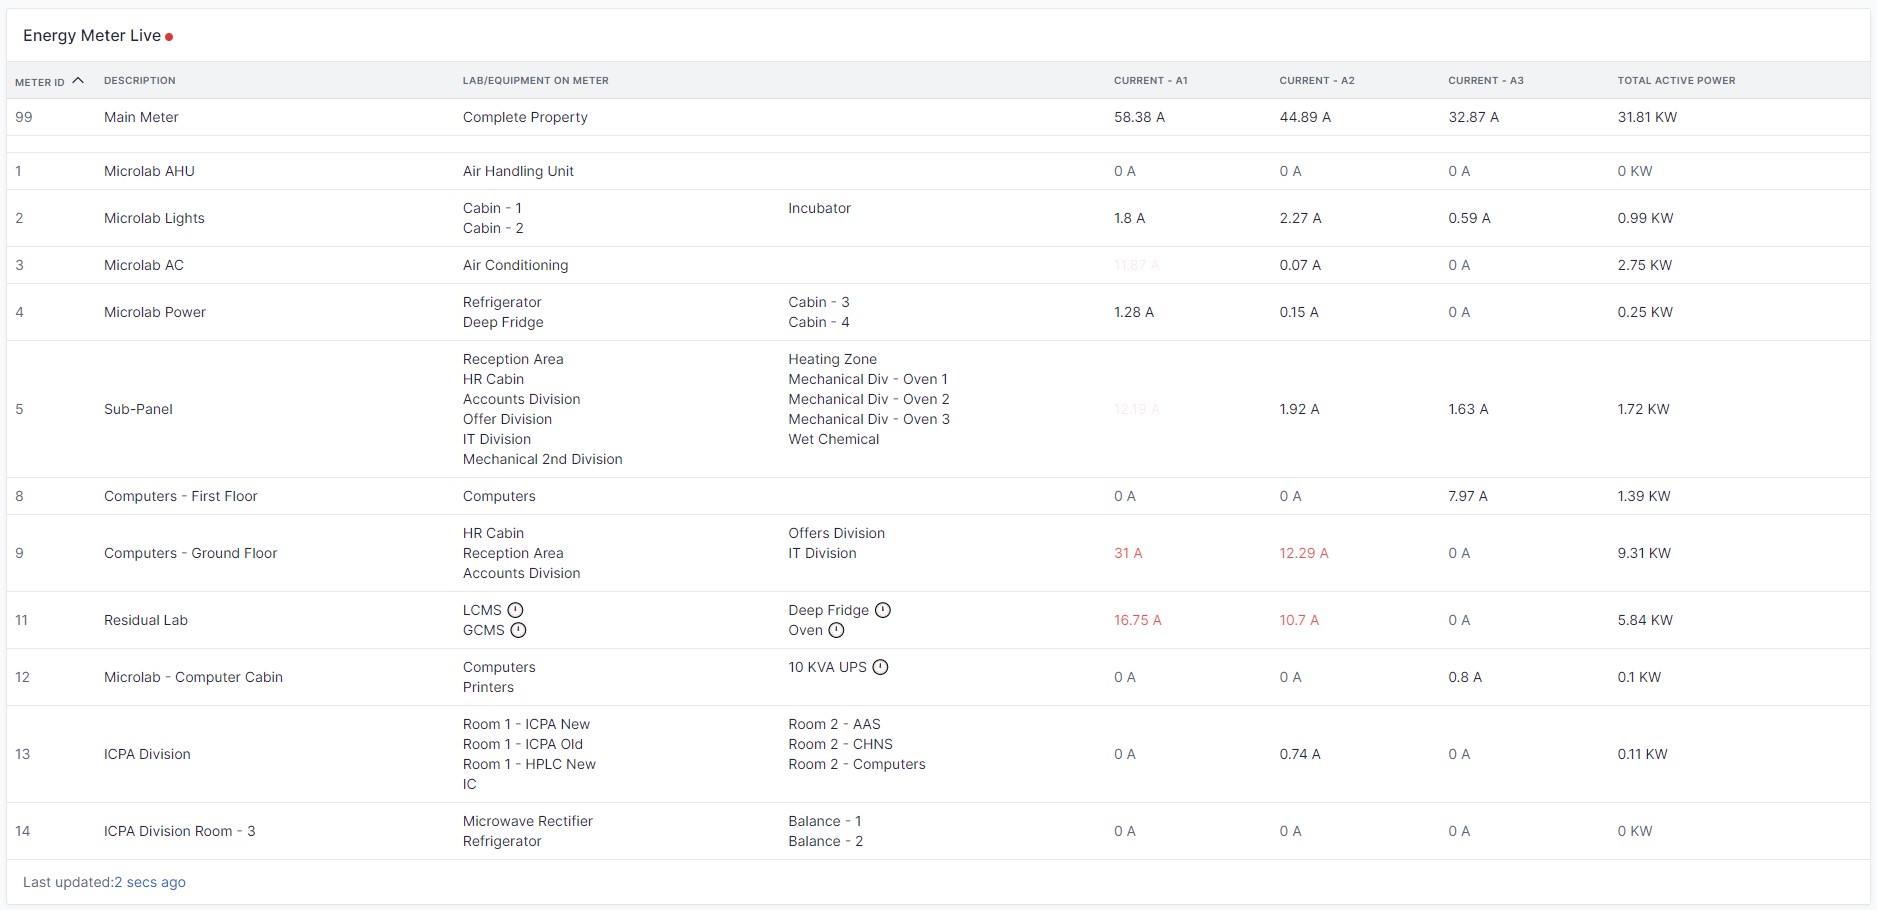
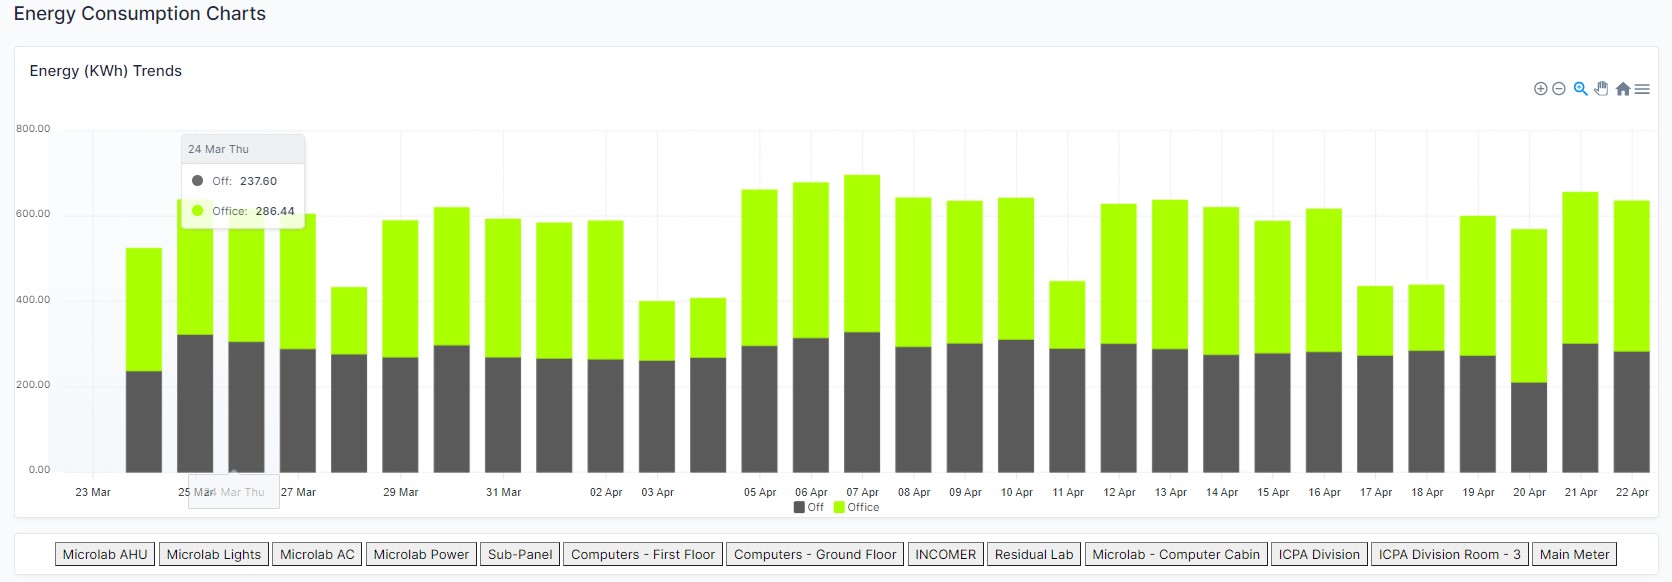
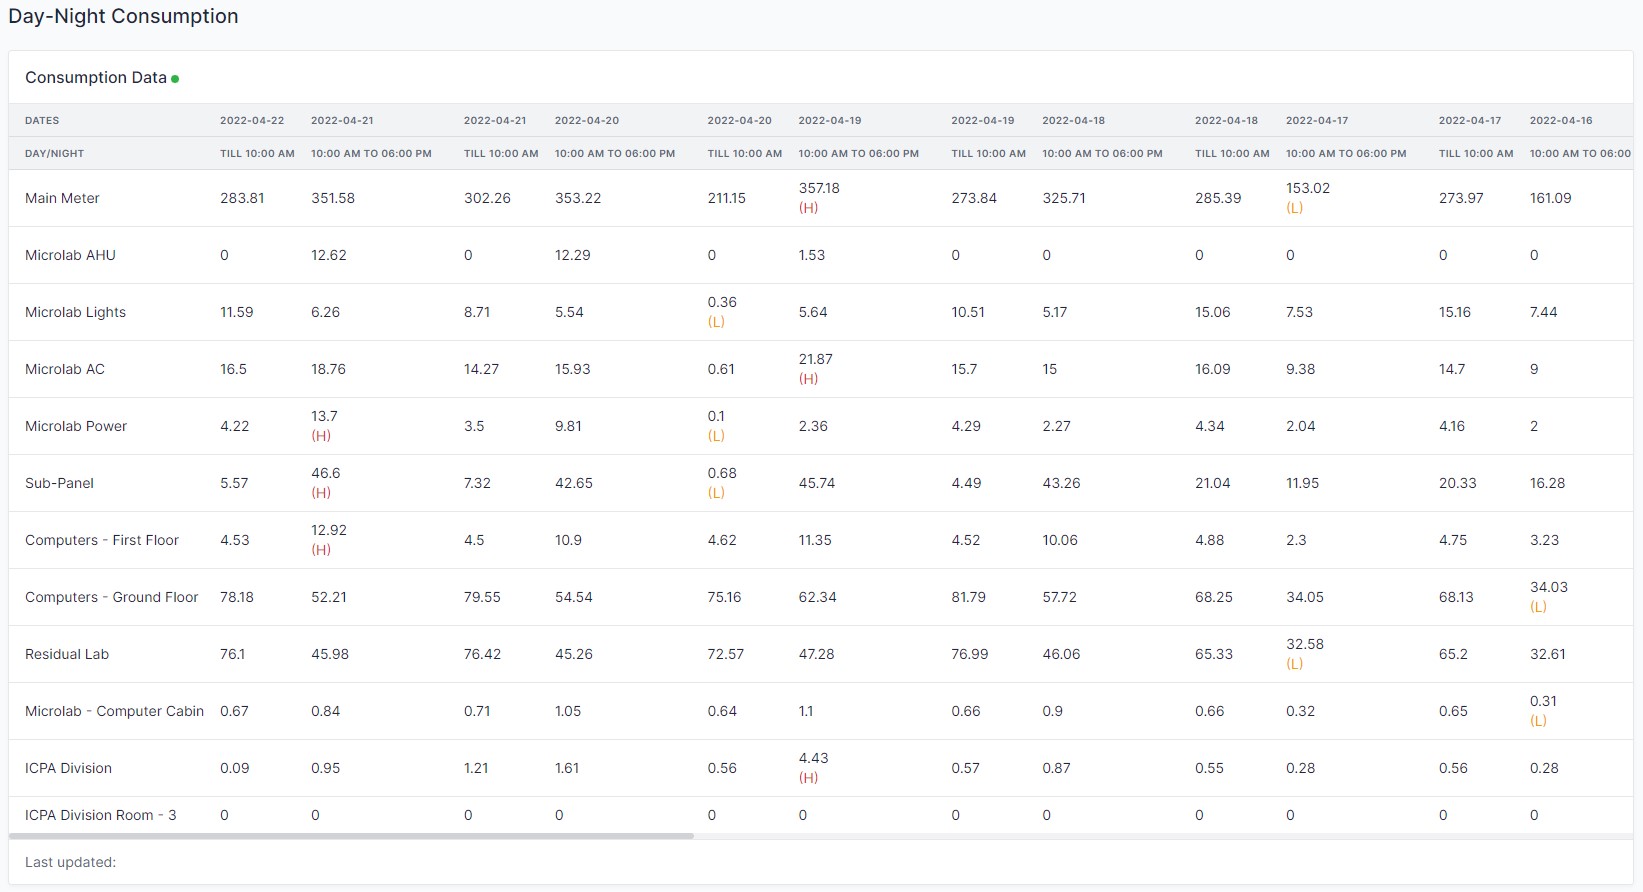
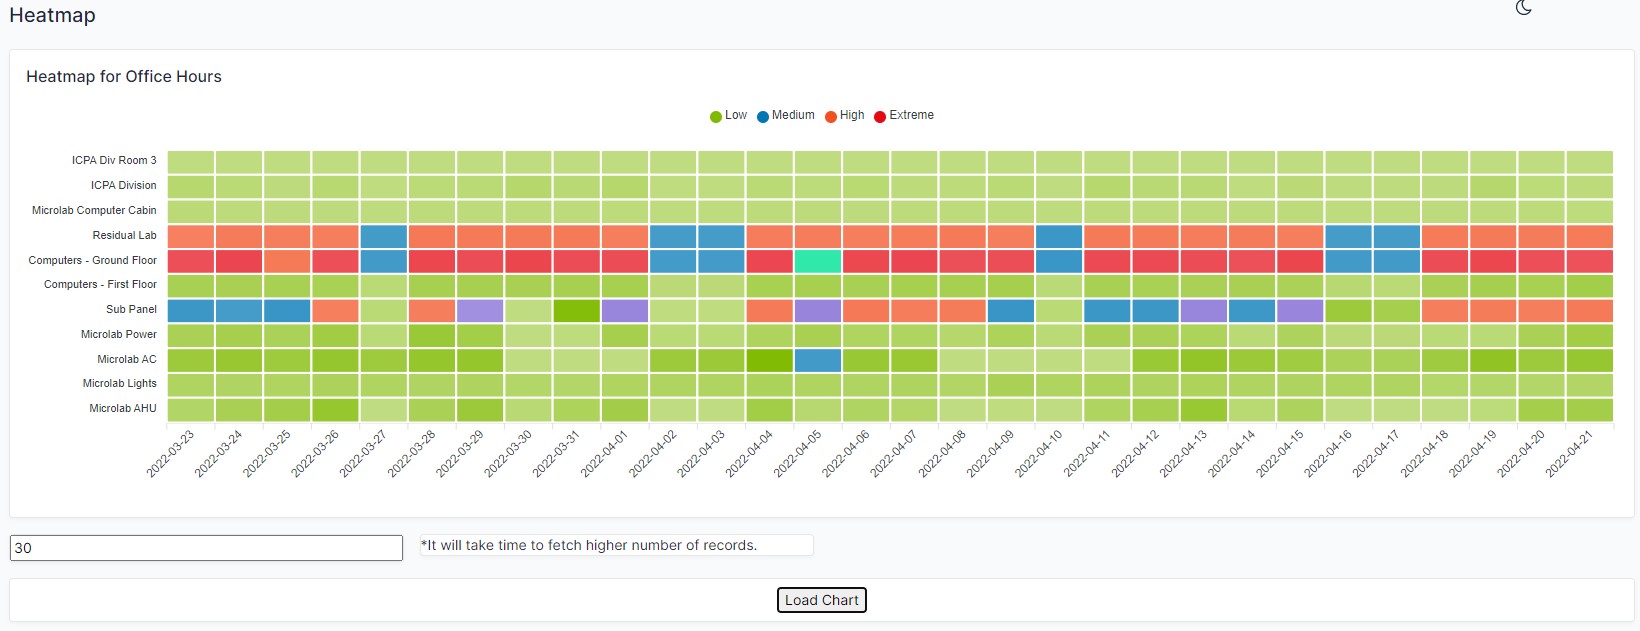
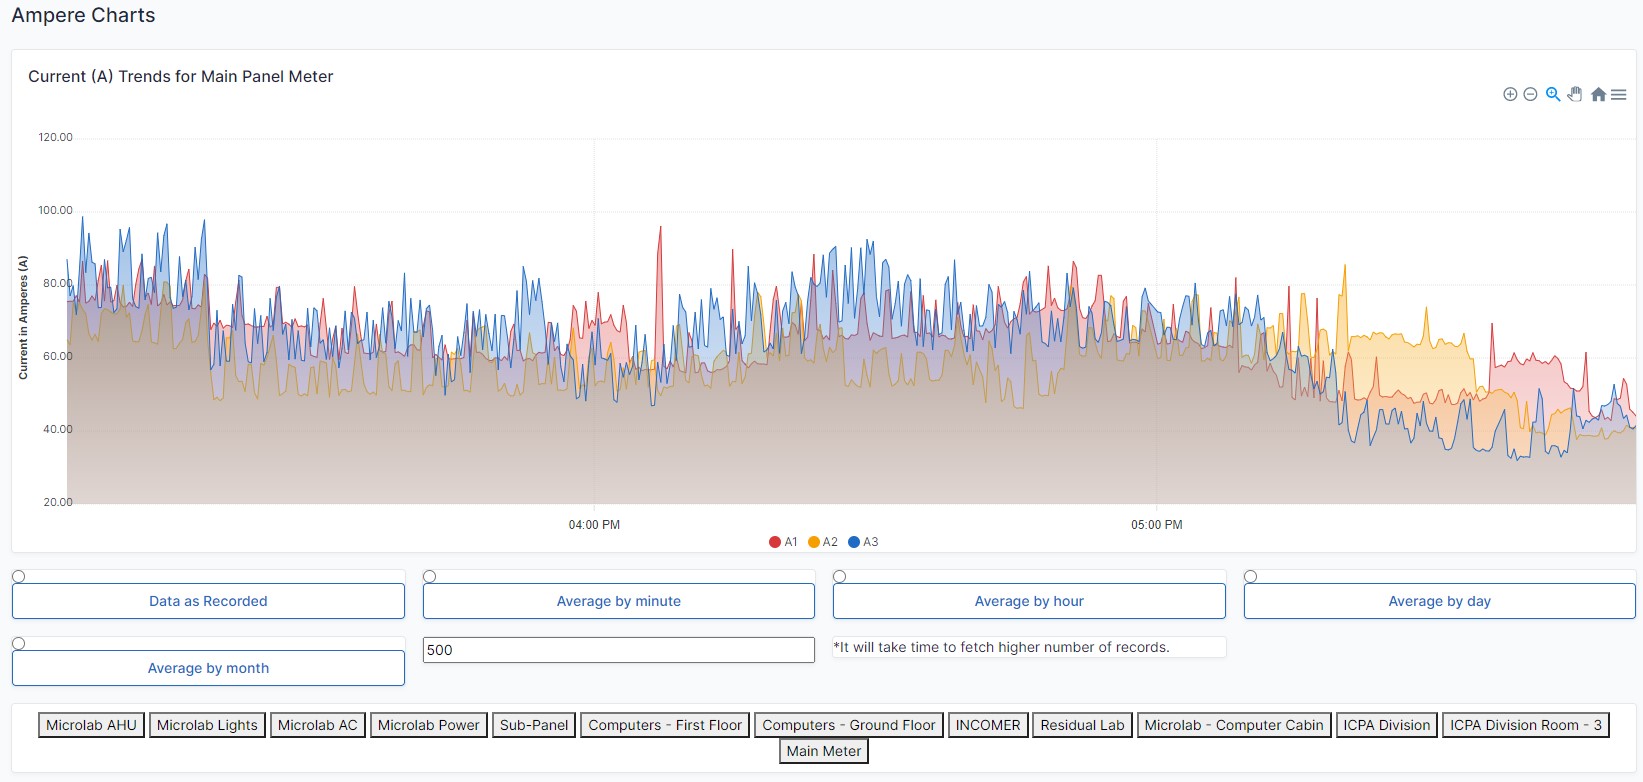
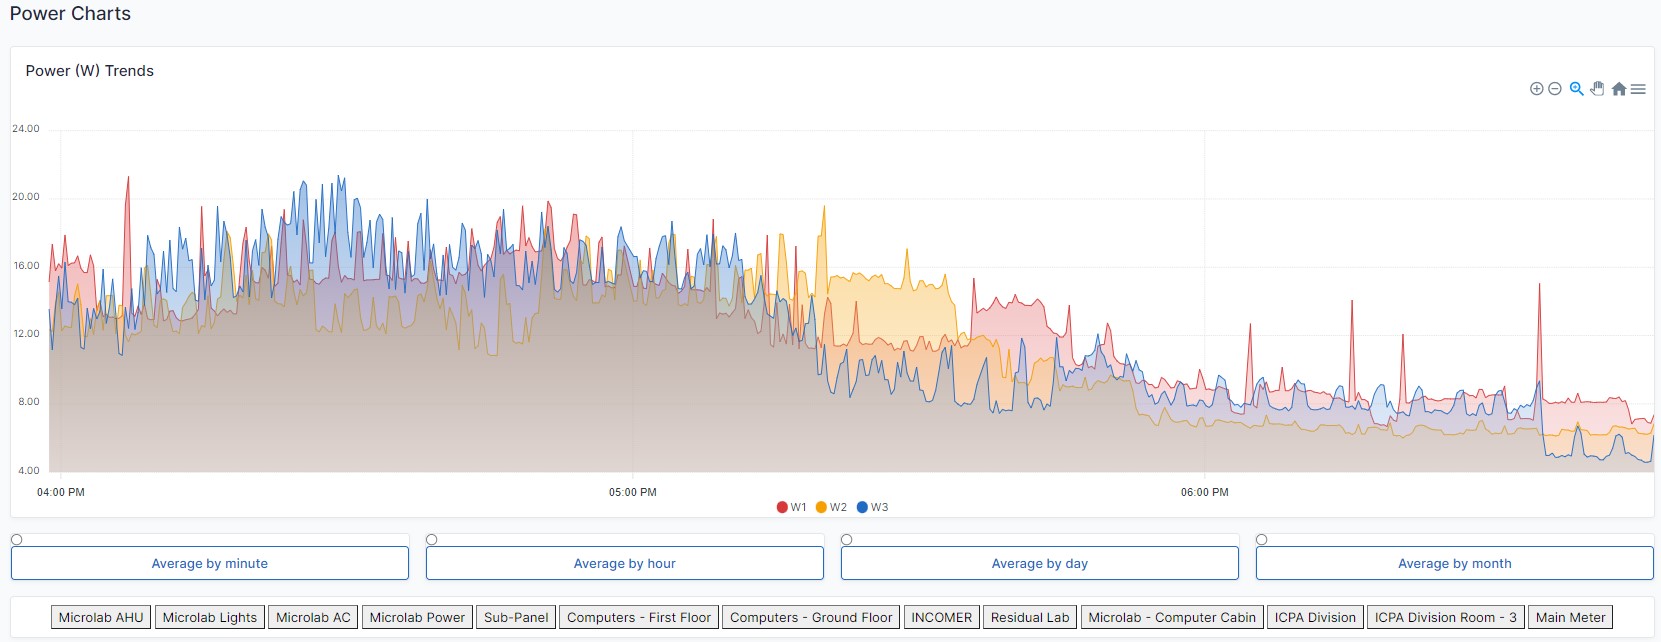
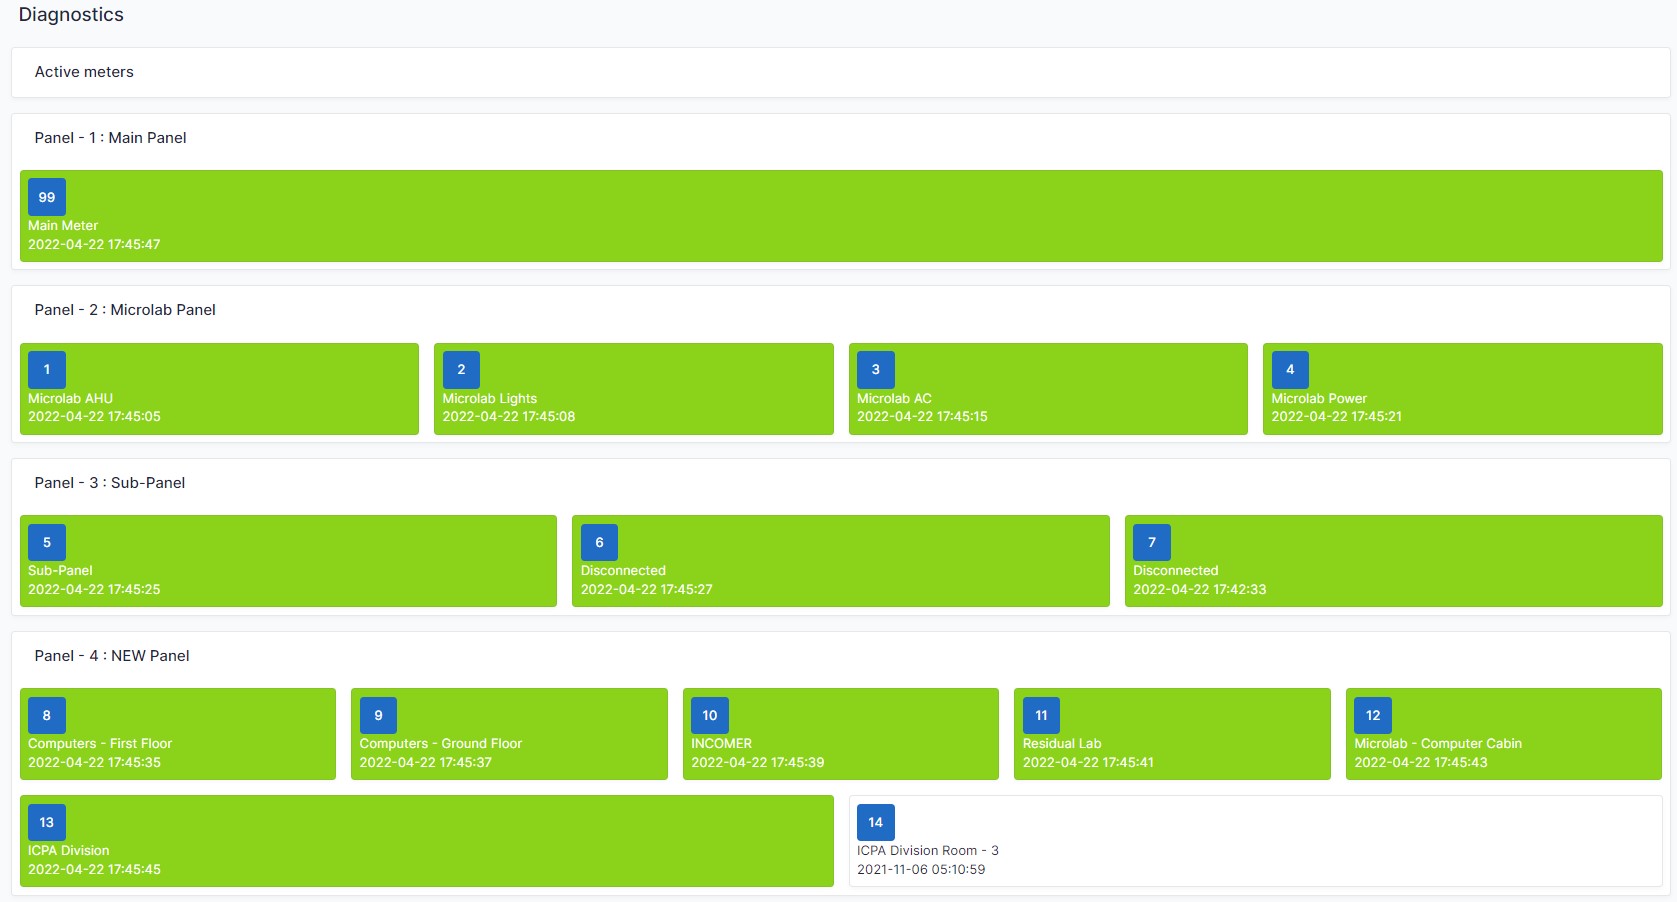
With Tuvis - Energy Monitoring System you can access and monitor energy consumption for your home, industry, office, hospital, in realtime from anywhere. Having realtime data raises awareness of the energy being consumed which makes you capabale of making better decisions for energy saving.

With realtime updates about energy and power consumption, you know exactly what is going on in your building, industry, hotel, hospital, or commercial establishment.

+91 98811 47391


Features of Tuvis - Energy Monitoring System
Parameters Recorded from every connected energy meter
Basic Parameters
◉ Energy (KWh)
◉ Total Active Power (W)
◉ Phase-wise Power (W)
◉ Phase-wise Current (A)
◉ Phase-wise Voltages (V)
◉ Frequency (Hz)
◉ Power Factor
Data
◉ All the Basic Parameters are recorded every minute
◉ Daily Peak and Off-peak Energy Consumption
◉ Daily 24-Hours Energy Consumption
Data Storage
◉ Stored on Energy Monitoring System unit at client
◉ Stored online
◉ Stored on private server
Messaging Service (SMS)
◉ Daily 24-Hours Energy Consumption
◉ Daily Peak Hours Consumption
◉ Daily Off-Peak Hours Consumption
◉ Alerts and Warning messages
Graphical Charts
Energy Consumption Charts
◉ Energy Consumption (Peak and Off-peak)
◉ Heatmap of Energy Consumption
Current levels
Voltage levels
Power levels
Realtime Graphs
◉ Power Consumption of all the energy meters
◉ Phase-wise power levels

Realtime Readings

Tuvis Energy Monitoring System

Version 2 is out

"when you can measure, don't calculate"
"what you can measure, you can manage"
Licensed Electrical Contractors, Distrbutors and Engineers

Dashboard

See realtime voltages, current and power from your dashboard.

Complete Heating, Ventillation and Air Conditioning Services

Realtime Power Consumption

Heating, Ventilation and Air Conditioning

Energy Monitoring Systems / Building Management Systems

Energy Consumption bar chart

Day Hours

Audit and Safety

Energy Consumption bar chart

Night Hours

Extra Low Voltage Systems

Device/Area wise Energy Consumption

Previous Day

CCTV

Device/Area wise ongoing consumption

Solar

Realtime Data

See realtime current/voltages/power across all connected devices

Telephone

Energy Consumption Charts

24 Hours Energy consumption (Day/Night) Hours

Access Control

Energy Consumption Table

Consumption data divided by day and night energy consumption

Fire Alarm and Annunciation

Heatmap

The highs and lows of energy consumed

Automation / IoT

Current level timeline chart

A meter wise line chart to understand current level across all three phases

Technology Services

Power Consumption

Check power consumption data of any device

Technology Services

Diagnosis

Check if energy meters are functioning properly

Tuvis Energy Monitoring System

Realtime Monitoring of Data
Logging of Electrical Parameters
Graphical User Interface
Daily Energy Consumption Messages (SMS)
Weekly Energy Consumption Data (E-mail)
Download Data (CSV)
List of Projects by Promoters and Project Engineers
Anacon Laboratories Private Limited, MIDC, Butibori
Energy Monitoring System for Anacon Laboratories Pvt. Ltd., MIDC, Butibori
Monitoring and Logging data from 15 nos of Schneider EM6436 and EM6436H (Hexa Series) Energy Meters
Communication over RS485 - Modbus protocol
2021